Showing posts with label example. Show all posts
Showing posts with label example. Show all posts
Monday, February 16, 2015
Drill down from one dashboard to another dashboard custom parameter example in pentaho CDE
This post teach you how to drill down from one dashboard to another dashboard by passing parameters.
Example developed on :
1) BA server - 4.8 version
2) C-Tools 13.09 version
3) Web browser : Mozilla firefox(Always preferable for pentaho C-Tools)
4) Database : foodmart (postgreSQL - jasper server default db).
Before learning this post I suggest you to have a glance at the previous post on the same drill down with out any parameters concept.
http://pentaho-bi-suite.blogspot.in/2013/11/drill-down-from-one-dashboard-to.html
Aim of the concept :
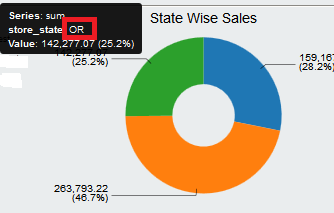
1) Click on state slice in dashboard 1
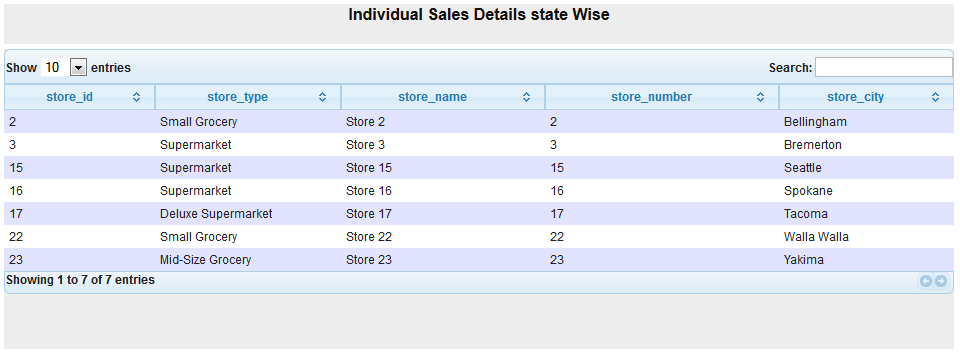
2) As soon as you click on particular state slice, you will be navigating to another dashboard displaying all the details of that state in another dashboard in the form a table.
i.e, Drill down from Pie Chart to Tabular display of data by passing parameter.
Dashboard 1 :
Create your chart(s) as shown in below figure you
1) Create a Simple parameter lets say param_custom_state ( No need of giving any default value )
2) Go to chart component properties
-> Give the data source(query created in data source section) that will fit for the above chart .
-> Give the above created parameter for "Listeners" as well for "Parameters".
3) In the clickAction write below code
function sendParameter(scene){
var url=http://localhost:8085/pentaho/content/pentaho-cdf-dd/Render?solution=CDEExploring&path=%2FTest&file=test_dev_drill.wcdf;
var vars = scene.vars;
var c = vars.category.value;
var v = vars.value.value;
alert("category: " + c + "
value: " + v);
value: " + v);
window.location=url+¶m_custom_state=+c;
}
NOTE : also look at this thread for URL passing.
http://forums.pentaho.com/showthread.php?165490-Need-help-with-dashboard-drill-down-url
NOTE :
1) URL = 2nd dashboard URL
2) url+parameter(which you are passing)
3) On pie chart, slice will take the category value( here the category value is "state" and represented by c)
4) This "state" will be the custom parameter for the 2nd dashboard.
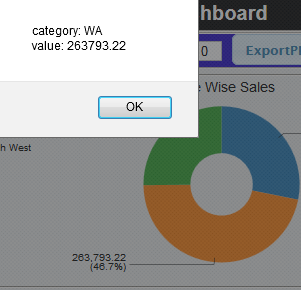
5) Give alert function whether the code is working fine or not (This is a testing methodology).
6) Note that drill down code slightly vary for other charts in pentaho CDE bz of protovis scripting changes as well as per new things in CCC2.(i.e., For bar chart drill down the given code may be differ from the code written here).
6) Note that drill down code slightly vary for other charts in pentaho CDE bz of protovis scripting changes as well as per new things in CCC2.(i.e., For bar chart drill down the given code may be differ from the code written here).
5) Save the dashboard and see the preview.. Once you click on slice itll alert saying that the selected state along with the value and then you can see the drill down to another dashboard.
Dashboard 2:
NOTE that you have to create 2nd dashboard separately and have to know how to get the URL of it.(Open In New Window)
Create a table component and suitable query for it where your query for the tabular display should take the input parameter "state" which is your custom parameter and on the table component give it as parameter also.
For instance : in where clause of your query .
where
s.store_state like ${param_custom_state}
1) Go to "Generic" section and click on custom parameter
2) Give the name for it (it is not mandatory to give the same name but preferable to give the same parameter name that you are receiving from 1st dashboard).
3) In the Java script code write below code
param_custom_state = Dashboards.getQueryParameter("param_custom_state");
Once you click on WA state in the above image , you will navigate to another dashboard which displays that particular state details. Sample image is shown below.
This is the way how you can work custom parameter for drill down functionality.
For tricks and tips navigate through my blog post and discover some thing interest in pentaho..
Add your inputs and improvements in comments :)
Same topic discussed in below posts :
1) http://pentaho-bi-suite.blogspot.in/2013/11/drill-down-from-one-dashboard-to.html
2) http://pentaho-bi-suite.blogspot.in/2013/12/pentaho-cde-dashboard-complete-example.html
Same topic discussed in below posts :
1) http://pentaho-bi-suite.blogspot.in/2013/11/drill-down-from-one-dashboard-to.html
2) http://pentaho-bi-suite.blogspot.in/2013/12/pentaho-cde-dashboard-complete-example.html

Sunday, February 15, 2015
My first learning example in Kettle An example is reproduced from Pentaho Tutorials Topic Filtering Rows
Hi Guys,
Here is my first learning experience with Kettle Community ETL.
Download Kettle from : Click Me
Sources to get start with Kettle :
1) http://wiki.pentaho.com/display/EAI/Getting+Started
2) http://localhost:8080/pentaho/docs/InformationMap.html
3) http://wiki.pentaho.com/display/EAI/Pentaho+Data+Integration+%28Kettle%29+Tutorial
You should have installed java in your local machine and path, java_home, jre_home set for it.
Below topic is a re-production of Kettle Transformation & Job example from Pentaho Tutorials and the description is slightly differ from the actual description.
Lets look at simple basics and then well jump into 1st example.
# What is Transformation in Kettle ?
# What are jobs in Kettle ?
# Core difference b/w Transformation & Jobs in Kettle ?
# Extensions for transformations & jobs in Kettle ?
# What are steps & hops ?
1) What is the usage of Transformation ?
Transformations are used to describe the data flows for ETL such as reading from a source, transforming data and
loading it into a target location.
2) Jobs
Jobs are used to coordinate ETL activities such as
Defining the flow and dependencies for what order transformations should be run
Preparing for execution by checking conditions such as, "Is my source file available?," or "Does a table exist?"
Performing bulk load database operations
File Management such as posting or retrieving files using FTP, copying files and deleting files
Sending success or failure notifications through email
3)Whats the difference between transformations and jobs?
Transformations are about moving and transforming rows from source to target. Jobs are more about high level flow control: executing transformations, sending mails on failure, ftping files
4) Extensions for transformations & jobs in Kettle ?
Transformation : .ktr
Jobs : .kjb
5) What are steps & hops ?
TOPIC :
Load sales data into a database. Several of the customer records are missing postal codes(zip codes) that must be resolved before loading into the database.
You will be given two .csv files to load the data into database.
The first file is : sales_data.csv and later one is Zipssortedbycitystate.csv
( Location of the files : /home/sada/softwares installed/Pentaho/data-integration/samples/transformations/files
)
In short , there is a column called "postalcode" in sales_data.csv with missing postal codes(i.e., the values are null) and need to fill the missed the missed postal codes using "postalcode" column of Zipsortedbycitystate.csv file.
Explanation :
The Final Transformation looks as shown in below :

The final job looks as shown in below(doing job is optional for this topic)

Transformation is divided into below sub tasks.
1) Retrieve Data From Flat File ( i.e., Retrieve Data From "sales_data.csv")
2) Filtering the records ( from the source file get only not null valued rows for "postal code").
3) Load to into Relational database ( Total Number of rows in this 2747)
4) Retrieve Data From your look-up file.
5) Resolve Missing zip information.
Download the example : Click Me
NOTE : While running the .ktr file (or .kjb file) in your environment you should specify the flat files(.csv files) location as per your folder structure.
#: Ive taken postgresql as output table.
Thank you.
Sadakar
BI developer.
(Pentaho/Jasper/Talend/Kettle).
:-)
Here is my first learning experience with Kettle Community ETL.
Download Kettle from : Click Me
Sources to get start with Kettle :
1) http://wiki.pentaho.com/display/EAI/Getting+Started
2) http://localhost:8080/pentaho/docs/InformationMap.html
3) http://wiki.pentaho.com/display/EAI/Pentaho+Data+Integration+%28Kettle%29+Tutorial
You should have installed java in your local machine and path, java_home, jre_home set for it.
Below topic is a re-production of Kettle Transformation & Job example from Pentaho Tutorials and the description is slightly differ from the actual description.
Lets look at simple basics and then well jump into 1st example.
# What is Transformation in Kettle ?
# What are jobs in Kettle ?
# Core difference b/w Transformation & Jobs in Kettle ?
# Extensions for transformations & jobs in Kettle ?
# What are steps & hops ?
1) What is the usage of Transformation ?
Transformations are used to describe the data flows for ETL such as reading from a source, transforming data and
loading it into a target location.
2) Jobs
Jobs are used to coordinate ETL activities such as
Defining the flow and dependencies for what order transformations should be run
Preparing for execution by checking conditions such as, "Is my source file available?," or "Does a table exist?"
Performing bulk load database operations
File Management such as posting or retrieving files using FTP, copying files and deleting files
Sending success or failure notifications through email
3)Whats the difference between transformations and jobs?
Transformations are about moving and transforming rows from source to target. Jobs are more about high level flow control: executing transformations, sending mails on failure, ftping files
4) Extensions for transformations & jobs in Kettle ?
Transformation : .ktr
Jobs : .kjb
5) What are steps & hops ?
- A transformation is a network of logical tasks called steps.
- Transformations are essentially data flows.
- The transformation is, in essence, a directed graph of a logical set of data transformation configurations.
- Steps are the building blocks of a transformation,
- for example a text file input or a table output.
- There are over 140 steps available in Pentaho Data Integration and they are grouped according to function; for example, input, output, scripting, and so on.
- Each step in a transformation is designed to perform a specific task, such as reading data from a flat file, filtering rows, and logging to a database
- Steps can be configured to perform the tasks you require.
- Hops are data pathways that connect steps together and allow schema metadata to pass from one step to another.
- Hops determine the flow of data through the steps not necessarily the sequence in which they run.
- When you run a transformation, each step starts up in its own thread and pushes and passes data.
TOPIC :
Load sales data into a database. Several of the customer records are missing postal codes(zip codes) that must be resolved before loading into the database.
You will be given two .csv files to load the data into database.
The first file is : sales_data.csv and later one is Zipssortedbycitystate.csv
( Location of the files : /home/sada/softwares installed/Pentaho/data-integration/samples/transformations/files
)
In short , there is a column called "postalcode" in sales_data.csv with missing postal codes(i.e., the values are null) and need to fill the missed the missed postal codes using "postalcode" column of Zipsortedbycitystate.csv file.
Explanation :
The Final Transformation looks as shown in below :
The final job looks as shown in below(doing job is optional for this topic)
Transformation is divided into below sub tasks.
1) Retrieve Data From Flat File ( i.e., Retrieve Data From "sales_data.csv")
2) Filtering the records ( from the source file get only not null valued rows for "postal code").
3) Load to into Relational database ( Total Number of rows in this 2747)
4) Retrieve Data From your look-up file.
5) Resolve Missing zip information.
Download the example : Click Me
NOTE : While running the .ktr file (or .kjb file) in your environment you should specify the flat files(.csv files) location as per your folder structure.
#: Ive taken postgresql as output table.
Thank you.
Sadakar
BI developer.
(Pentaho/Jasper/Talend/Kettle).
:-)
Saturday, January 17, 2015
Html5 Example showing some graphics example using css3
Hi , i am going to explain you how to create a graphics or animations with out java script page background for your website using html5 and css3. First create a file named index.html and paste the following code shown below:
Now create a file named style.css and replace with the following code:
	CSS3 animation


	Developed By: Vivek Kumar
body {
	background-color: #F6F4F2;
	font-family: "Helvetica Neue", Helvetica, Arial, sans-serif;
	font-size: .9em;
	line-height: 1.1em;
	margin: 0px;
}
h1,ul,li {
	margin: 0px;
	padding: 0px;
}
#header {
	background-color: #515151;
	background: #515151
		-webkit-gradient(linear, left top, left bottom, color-stop(0.2, #515151),
		color-stop(0.8, #302F2D) );
	border-top: 1px solid #919192;
	height: 32px;
	left: 0px;
	position: fixed;
	top: 0px;
	width: 100%;
	z-index: 1;
}
#subheader { display: none; }
#footer {
	display: none;
	background-color: #515151;
	background: #515151
		-webkit-gradient(linear, left bottom, left top, color-stop(0.2, #515151),
		color-stop(0.8, #302F2D) );
	border-top: 1px solid #919192;
	height: 32px;
 	position: fixed;
	bottom: 0px;
	width: 100%;
	z-index: 1;
}
#sidebar {
	background-color: #ECEAE7;
	overflow: auto;
	padding: 30px 2% 20px 0px;
	text-align: right;
    /* position: fixed; */
	float: left;
	width: 22%;
	top: 33px;
	bottom: 0px;
	z-index: 1;
	border-right: 1px solid #999;
}
#sidebar ul,#sidebar li {
	margin: 0px;
	padding: 0px;
}
#sidebar li, #sidebar li a {
	color: #767573;
	font-size: 1.06em;
	list-style: none;
	margin: 1.05em 0px;
}
#scrollable {
	/* position: fixed; */
	padding: 20px 2% 0px 1%;
	float: right;
	width: 72%;
	overflow: auto;
	top: 33px;
}
#content {
	margin: 20px 2% 0px;
	color: #313131;
	/*  position:absolute;*/
	/*  overflow:auto;*/
	z-index: 0;
}
#header h1, #footer h1 {
	color: #F6F4F2;
	font-size: 1.2em;
	font-weight: normal;
	line-height: 32px;
	margin: 0px;
	text-align: center;
	text-shadow: 0px -1px 1px #222222;
}
#footer h1 {
	font-size: .9em;
	text-align: left;
	padding-left: 16px;
}
#content h2 {
	border-bottom: 1px solid #ccc;
	padding-bottom: 0.25em;
	color: #e87a12;
	font-size: 1.4em;
	font-weight: bold;
	margin: 1.3em 0px 0.8em 0px;
	text-shadow: #FFFFFF 0px 1px 1px;
}
code {
	font-weight: bold;
	font-size: 1.0em;
	color: #bc6108;
}
blockquote {
	color: #767573;
	font-style: normal;
	margin-left: 30px;
	margin-right: 10px;
	padding-left: 6px;
	position: relative;
	text-shadow: #FFFFFF 0px 1px 0px;
}
blockquote p {
	padding: 5px 0px;
	font-size: 0.8em;
}
blockquote::before {
	font-style: normal;
	content: 201C;
	font-size: 400%;
	font-family: Georgia, Palatino, Times New Roman, Times;;
	position: absolute;
	left: -25px;
	top: 0.2em;
	color: #E0E0E0;
}
ul {
	margin-left: 40px;
}
ul>li {
	list-style: disc;
	list-style-position: outside;
}
ul ul {
	margin-bottom: 0.5em;
	margin-top: 0.5em;
}
a.btn {
  	border: 1px solid #555;
  	-webkit-border-radius: 5px;
  	border-radius: 5px;
  	text-align:center;
  	display:block;
/*   	float:left; */
  	clear: both;
  	background:#eceae7;
  	width:90%;
  	color:#e87a12;
  	font-size:1.1em;
  	font-weight: bold;
  	text-decoration:none;
  	padding:0.7em 0.1em;
 	margin: 5px auto;
}
a.btn.deux {
	clear: none;
	float:left;
  	width: 45%;
  	margin:6px 3px 3px;
}
a.btn.trois {
	clear: none;
	float:left;
	width: 30%;
  	margin:6px 2px 3px;
}
#deviceinfo {
	border-collapse:collapse;
	width:75%;
	margin: 20px auto;
}
#deviceinfo tr th.alt, #deviceinfo tr td.alt {
	text-align:left;
}
#deviceinfo, th, td {
	border: 1px solid #ccc;
}
#deviceinfo th {
	font-size:1.15em;
	padding-top:4px;
	padding-bottom:4px;
	background-color:#e89442;
	color:#f0f0f0;
	height: 1.3em;
}
#deviceinfo td, #deviceinfo th {
	padding:3px 7px 2px 7px;
	vertical-align:bottom;
	text-align:right;
}
.result-block {
	clear: both;
	margin-top: 0.3em;
}
#accel-data {
	margin-bottom: 15px;
	width: 95%;
}
dl{
  	clear:both;
  	list-style-type:none;
  	padding-left:2px;
  	overflow:auto;
}
dl > dt{
  	float:left;
  	margin-top: 15px;
  	margin-left:5px;
}
dl > dd{
  	float:left;
  	font-weight:bold;
  	margin-top: 15px;
  	margin-left: 10px;
  	margin-right: 25px;
  }
.api-div {
 	display: none;
	margin-bottom: 0.6em;
}
.api-div h4 {
 	display: block;
 	font-size: 0.8em;
 	font-weight: normal;
 	background: #eceae7;
 	border-left: 6px solid #de2c2c;
 	padding: 5px 8px;
}
.api-div .help {
 	border-left: 6px solid #188f8f;
}
#cameraImage {
	border: 2px solid #666;
	display: none;
	margin: 1.7em auto;
	width:200px;
	height:150px;
}
#eventOutput {
	height:1.5em;
	display: block;
}
#map {
	width: 180px;
	height: 140px;
	border: 2px solid #666;
 	display: none;
	margin: 1.0em auto;
}

@media screen and (max-width: 320px) and (orientation:portrait) {
	/* #header h1 { color: #f00; }  For TESTING */
	#sidebar { display: none; }
	#scrollable {
		padding: 0px;
		margin: 64px 1% 0px 1%;
		float: left;
		width: 97%;
		overflow: auto;
	}
	#subheader {
		display: block;
		background-color: #CBCBCB;
		background: -webkit-gradient(linear, left top, left bottom, color-stop(0.0, #F9F9F9),color-stop(1.0, #CBCBCB) );
		border-top: 1px solid #383A3C;
		border-bottom: 1px solid #919395;
		height: 42px;
		left: 0px;
		position: fixed;
		top: 33px;
		width: 100%;
		z-index: 1;
		text-align:center;
		}
	select {
		font-size: 1.65em;
		font-weight: bold;
		padding: 5px 16px 5px 20px;
		color: #444;
		background-color: #e8a35f;
		margin: 3px auto;
	}
	#deviceinfo {
		width:90%;
	}
}
@media all and (min-width: 800px){
	 /* #header h1 { color: #0f0; } FOR TESTING */
	#content {
		font-size: 1.0em;
		line-height: 1.2em;
	}
	#content h2 {
		padding-bottom: 0.4em;
		font-size: 2em;
 		margin-top: 2em;
	}
	blockquote {
		margin-top: 20px;
		margin-bottom: 30px;
	}
	blockquote p {
		/* padding: 5px 0px; 10px 0px; */
		font-size: 0.95em;
	}
	blockquote code {
	  	font-size: 1.2em;
	}
	#cameraImage {
		width: 400px;
		height: 300px;
    }
    #map {
		width: 360px;
		height: 280px;
		margin: 1.5em auto;
	}
	#content {
		margin: 30px 3% 0px;
	}
	#sidebar {
		padding-top: 15px;
    	position: fixed;
	}
	#sidebar li,#sidebar li a {
		font-size: 1.2em;
		margin: 1.8em 0px;
	}
	.api-div h4 {
 		font-size: 0.9em;
	}
	#footer {
		display: block;
	}
}

@media all and (min-width: 1200px){
	/*#header h1 { color: #ff0; }   FOR TESTING */
	blockquote p {
		/* padding: 5px 0px; 10px 0px; */
		font-size: 1.0em;
	}
	blockquote code {
	  	font-size: 1.3em;
	}
	#deviceinfo {
		width:50%;
	}
	#deviceinfo th {
		font-size:1.35em;
		height: 1.4em;
	}
	#deviceinfo td, #deviceinfo th {
		font-size: 1.1em;
	}
	#footer {
		display: none;
	}
}
Subscribe to:
Posts (Atom)